
The Menu tab on the COGS page shows how many plates of each dish you sold and how much money each one left you after its food cost. With those two numbers you can sort every dish into one of four groups: Stars, Plowhorses, Puzzles and Dogs.
The table doesn't print the group names, only the numbers they come from. The steps below turn those numbers into the four groups.
Words used in this article
- COGS: cost of goods sold. In plain words, what your food costs you.
- POS: point of sale, the register system your servers ring orders into.
- Food cost per plate: what the ingredients in one serving cost, priced from your invoices.
- Margin per plate: what one plate sold for, minus its food cost.
- Contribution: margin per plate times plates sold. It is the money a dish left you over the date range, before labor and overhead (rent, utilities and the like).
- Fully costed: every line in the dish's recipe has a price.
- Modifier: an add-on or change rung up on the POS, like "add bacon" or "no bun".
- Menu engineering: a way to sort dishes by two tests, how well they sell and how much each plate earns.
The four groups
| Group | Sells well? | Earns well per plate? | What it usually needs |
|---|---|---|---|
| Star | Yes | Yes | Keep it as it is and watch its ingredient prices. |
| Plowhorse | Yes | No | A lower food cost, or a small price increase. |
| Puzzle | No | Yes | Help more guests notice it. |
| Dog | No | No | Change it or take it off the menu. |
Before you start
- Your role. You need View access to Food cost & recipes. Owners, Admins, Location managers, Bookkeepers and the View only role have it. To change a recipe or a price after you read the numbers, you need Edit access to Food cost. Owners, Admins and Location managers have that. Only a workspace owner can change roles. See Give each person only the pages they need.
- Your POS is connected. Sales come from your POS: Toast and SpotOn today, and we add your POS on request. See Connect your POS sales.
- Your dishes have recipes with prices. On the Overview tab, Sales fully costed shows the share of your sales where every recipe line has a price. A dish with a missing price can't be sorted fairly, because its margin looks bigger than it is. See Add recipes from a photo, spreadsheet or typed list.
- A month of sales. A week is too short for dishes that only sell a few times a week.
Sort your menu into the four groups
The numbers below are a made-up example for Juniper Kitchen · Main Street. Use your own.
In the sidebar, click COGS, then click the Menu tab. It opens on Items, a table with one row for each dish sold. The switch above the table also has Modifiers, Categories and Modifier impact.
Pick a date range with the chips at the top of the page. 30d is the last 30 days and LM is last month. Custom lets you pick your own dates.
The page header says "Sales through" and a date. With Toast that is usually yesterday, because Toast sends its sales once a night.
Set Filter by category to All categories and Show to All items. Then look at the Total row at the bottom of the table. In our example it reads "Total · 40 items", and the Units column shows 6,000 plates sold.
Now work out the line for "sells well":
- Divide the plates sold by the number of items: 6,000 ÷ 40 = 150. That is the even share, what each dish would sell if every dish sold the same.
- Take 70% of the even share: 150 × 0.7 = 105.
A dish that sold 105 plates or more in this range sells well. The 70% line is the usual menu engineering rule of thumb, and it is the one the report's own math uses.
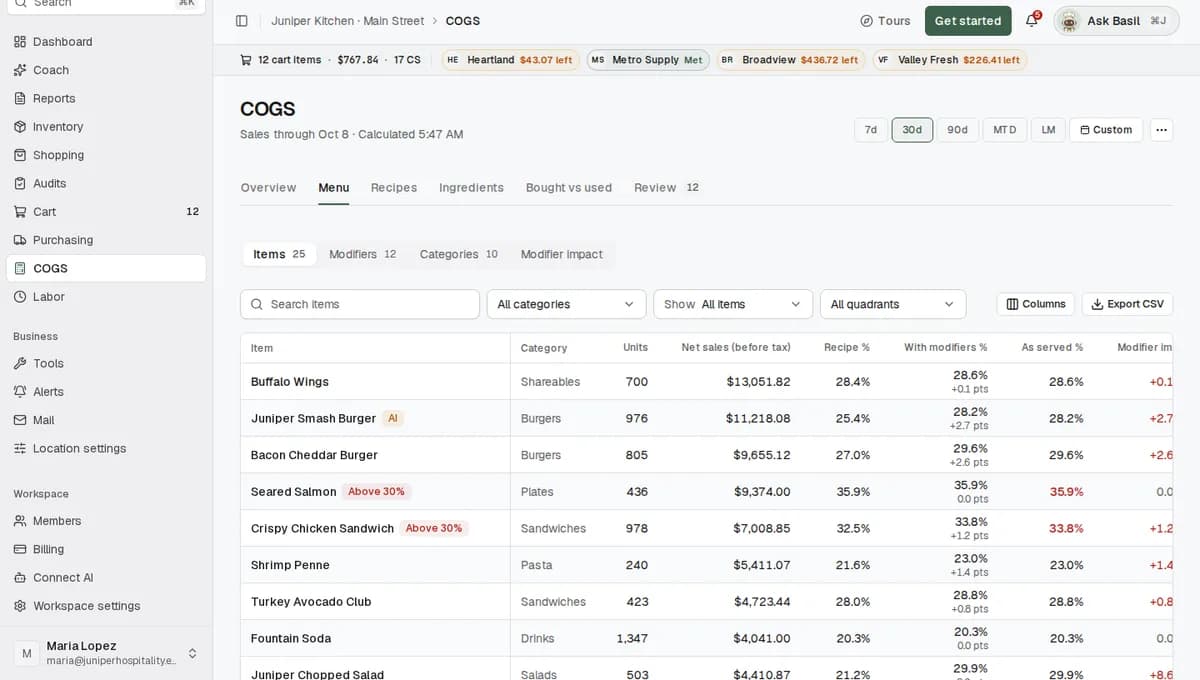
Set Show to Fully costed. The Total row now covers only the dishes whose every recipe line has a price. In our example it shows 5,000 under Units and $45,000 under Contribution.
Work out the average margin per plate: $45,000 ÷ 5,000 = $9.00. A dish that leaves $9.00 or more per plate earns well.
Work out each dish's margin per plate. Divide its Contribution by its Units. For Buffalo Wings that is $2,387 ÷ 310 = $7.70.
The table opens sorted by Contribution, highest first. Click a column header to sort by that column instead, for example Units.
To see the price and the cost behind each margin, click Columns and turn on Avg item price and Recipe cost each. The columns you pick stay on in this browser.
Put each dish in its group:
Dish Units Contribution Margin per plate Sells well (105+)? Earns well ($9.00+)? Group Juniper Smash Burger 420 $4,410 $10.50 Yes Yes Star Buffalo Wings 310 $2,387 $7.70 Yes No Plowhorse Seared Salmon 80 $1,352 $16.90 No Yes Puzzle Pulled Pork Sandwich 70 $588 $8.40 No No Dog Leave two kinds of rows out. Dishes with a Missing prices or No recipe badge need fixing first. Sides that sell for under $1 on average, such as fries that come with a sandwich, belong to the dish they go out with.
To do the math in a spreadsheet, click Export CSV. The file has the rows on screen, in the order shown, with every column.
Look closer at one dish
Click a dish's row to open its window. The numbers at the top cover the date range you picked:
- Net sales (before tax), with plates sold and the average price, for example "310 sold · avg $14.00".
- Food cost without modifiers: every plate as the recipe is written, as a share of sales and per plate.
- Food cost with modifiers: what was really served, including add-ons, removals, swaps and the sides that came with it. Your food cost target shows next to it, and the number turns red when the dish is over target.
- Modifiers added: how much the modifiers moved the cost.
- Gross profit: sales minus food cost with modifiers, for example "55.0% margin · $7.70 an item".
Below them, What the recipe cost is made of lists each ingredient line with its amount, price, cost and share of the plate. Click a line to see where its price came from, such as the last price you paid Prairie Meats on a delivery. Served as shows each way the dish went out with its sides. Sales by day has one bar per day.
Use the arrows in the window to move to the next or previous dish.
What to do with each group
Stars. Keep the recipe and the portion as they are. Watch the prices of their main ingredients. On the Overview tab, Vendor price changes lists ingredients whose price moved 3% or more between deliveries, with the menu items they touch. You can also set an alert. On the Alerts page, start from Recipe cost over $5 and change the amount to fit the dish. See Create an alert in plain language.
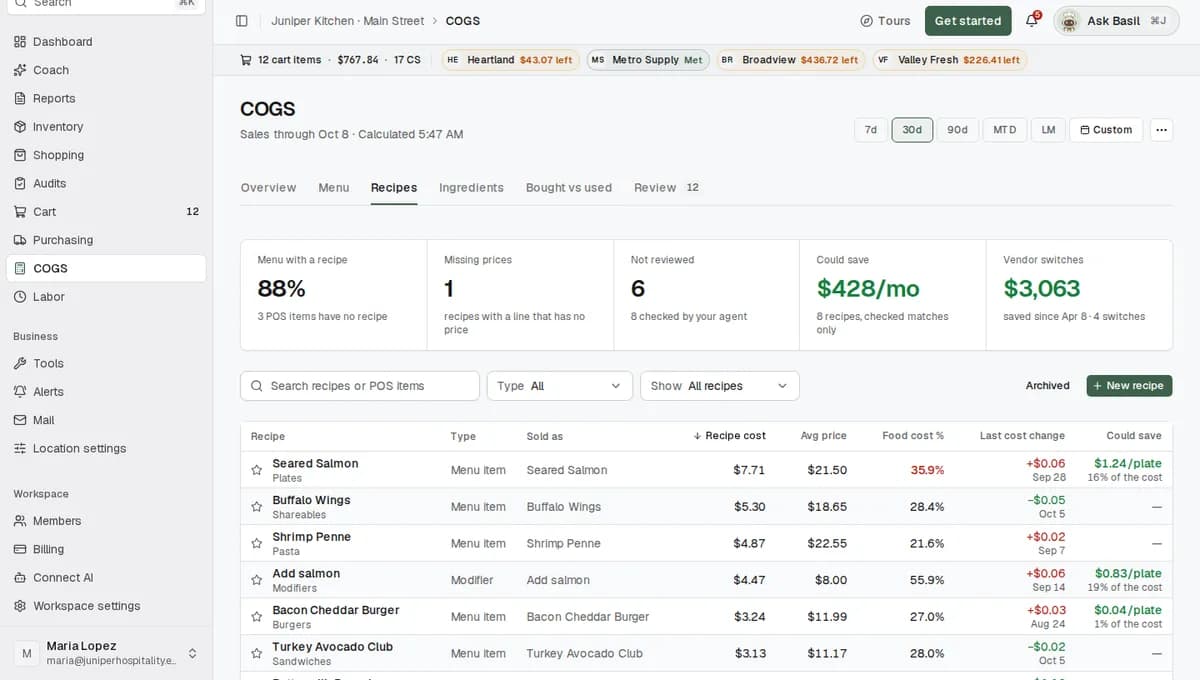
Plowhorses. Guests already order them a lot, so a small saving per plate adds up. Open the dish on the Recipes tab and look at Cheaper options. It lists the same ingredient at a lower price from another vendor you buy from. Click Use for this recipe, or Use in every recipe to switch it everywhere. For the wings, chicken wings are $5.25 of a $6.10 recipe. If Heartland Foodservice sells the same jumbo wings for $0.40 a pound less than Prairie Meats, that is $0.50 a plate, or $155 over the 310 plates in this range. Also check the portion in What the recipe cost is made of, and look at Modifier impact ranked by Money lost for add-ons that are charged less than they cost. A small price increase is the other way to fix a Plowhorse.
Puzzles. Each plate earns well, but few guests pick the dish. Move it to a better spot on the menu, ask servers to mention it, or describe it better. Check the price too, since a high price can be why few people order it. Open the dish and look at Sales by day to see whether it only sells on some days.
Dogs. Before you drop one, check whether it is new, seasonal or a dish that brings a regular table in. If none of those apply, rework it (a cheaper ingredient, a smaller portion or a new price) or take it off the menu. A dish with an AI chip has a recipe our AI drafted that nobody has confirmed yet. Check that recipe on the Review tab first, so you don't drop a dish because of a wrong recipe.
What happens next
Every night, RestaurantMate recalculates food cost for the last 35 days from your POS sales and the prices on your invoices. Each day's cost is saved, so past days keep the prices you paid at the time.
When you change a recipe or a price, or click More actions and then Recalculate, the numbers update in the background. That usually takes a few minutes. The header shows "Updating" while it runs and "Calculated" with a time when it is done.
Prices come from your invoices. A price set by hand comes first, then the last price you paid on a delivery, then the vendor's list price if nothing has been delivered yet. AI never guesses a price.
Run the same steps a month after a change to see whether the dish moved groups.
Tips
- Compare like with like. Drinks sell a lot of units at a small margin, which can make every food dish look slow. Run the two tests one category at a time. Pick a category in Filter by category, then read the Total row as in steps 3 and 4.
- Use dollars, not percent. The groups compare margin in dollars per plate. A $26 salmon at 35% food cost leaves $16.90. A $3 soda at 10% food cost leaves $2.70. Margin % in Columns helps with pricing, but use dollars for the four groups.
- Fix missing prices first. Set Show to Missing prices. A recipe cost in amber is short by the lines that have no price. The Review tab lists what to fix, with buttons like Set a price and Create recipe.
- Keep it on your dashboard. The Menu items by food cost widget ranks dishes by Highest food cost %, Most profit or Most sales.
Troubleshooting
A dish has no Contribution. It has no recipe yet and shows a No recipe badge. Create one from the Review tab with Create recipe, or ask us to set it up.
A dish's margin looks too good. Look for an amber recipe cost or a Missing prices badge. Some lines in its recipe have no price, so the cost is short. Set the missing prices, then read the dish again.
A side shows food cost over 100%. Sides that come with a dish are rung up at $0, so they show cost with no sales on their own row. The cost belongs to the dish they go out with. Open that dish and look at Served as. Leave sides out of the four groups.
Gross profit in the window doesn't match Contribution ÷ Units. The window counts the sides that went out with the dish, so a sandwich served with fries shows a little less. Use Contribution ÷ Units for the four groups, so every dish is measured the same way.
Every dish is in one category. Some POS menus don't send categories. The category filter then has nothing to split on. Run the tests on All categories.
The numbers look old. If the header says "Out of date" or "Update queued at" a time with "not started", click More actions and then Recalculate. If it still doesn't start, the nightly run updates it.
COGS isn't in your sidebar. Your role doesn't include Food cost & recipes, or the page is hidden for your role. Ask a workspace owner.
Common questions
Why doesn't the table say Star or Dog next to each dish? The table shows the numbers the groups come from: Units for how well a dish sells and Contribution for how much it earns. The steps above turn those into the four groups. If you use the in-app agent, you can also ask it, for example "Which dishes were Plowhorses last month?" It sorts all the dishes at the location together, the same way as steps 3 and 4.
Do add-ons and "no bun" count? Yes. Contribution uses what each modifier was charged and what it cost, as rung up on your POS. That covers add-ons, removals and swaps. The Modifier impact view shows how much modifiers added to food cost.
Does the margin include labor? No. Contribution and Gross profit are sales minus food cost. Labor and overhead are left out.
Where do the food costs come from? From your invoices. Each recipe line uses the last price you paid, per pound, per ounce or per each. A price set by hand wins. If nothing has been delivered yet, the vendor's list price is used and labeled as a list price.
Which date range should I use? At least 30 days. To see whether a change worked, compare the month before it with the month after, using LM or Custom.